Faster sites, happier users = more conversions
AllyRight AI identifies bottlenecks and helps eliminate them.

400 Million+
Pages Audited
80 Billion+
Issues Detected
That's a lot of broken code — and a lot of users who never even noticed, thanks to AllyRight.
Stretch your site speed — hit those Core Web Vitals
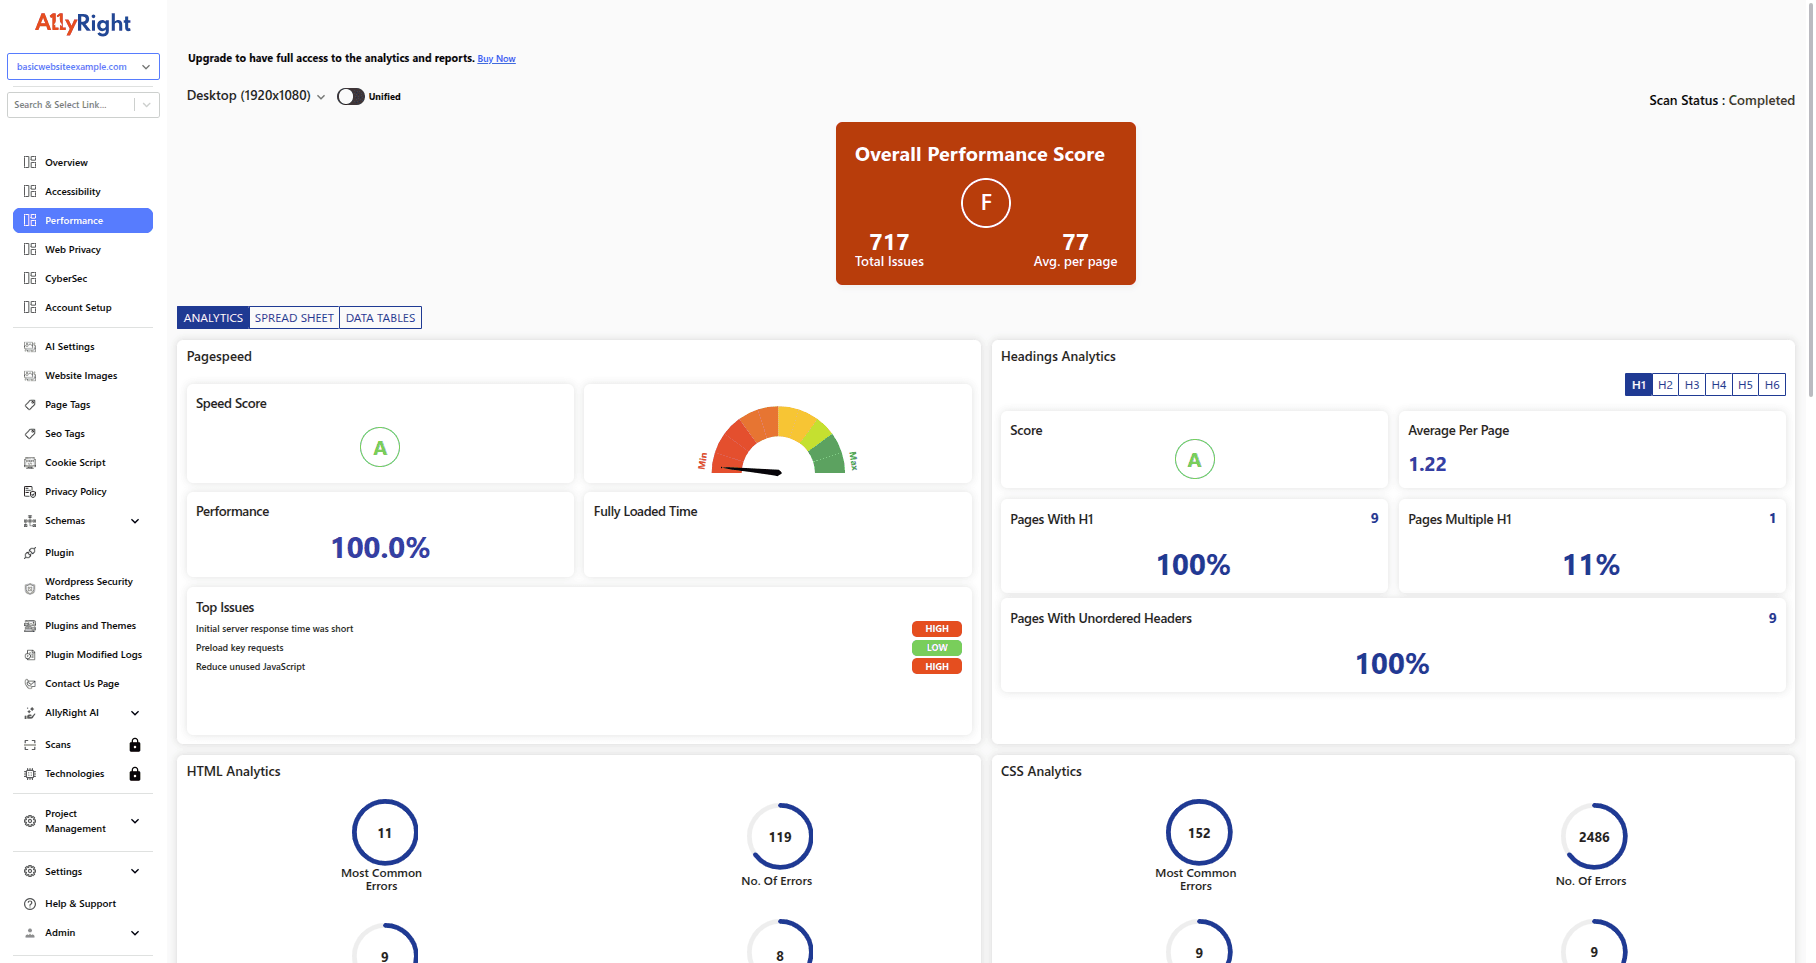
Fast websites drive satisfaction, search visibility, and conversions. AllyRight AI automates page speed testing, identifies bottlenecks like slow scripts and oversized images, and applies safe fixes to eliminate them. The result: better Core Web Vitals, faster page loads, and a smoother experience across every device.
Performance — Risk of Non-Compliance
Slow sites don't just frustrate users — they sabotage revenue. Google ranks based on Core Web Vitals, meaning poor speed hurts both SEO and customer experience.
High bounce rates
Each second of delay drives visitors away permanently.
Revenue drops
Even tiny slowdowns cut conversion rates and sales.
SEO penalties
Search engines reward fast-loading sites and punish laggards.
Mobile struggles
On-the-go users abandon sluggish mobile pages instantly.
Brand frustration
A slow site feels outdated and untrustworthy, damaging reputation.
How AllyRight AI Works
Lightning-fast crawl
AllyRight scans up to 15,000 pages per second, surfacing every performance bottleneck.
Deep multi-module analysis
One tool integrates Core Web Vitals monitoring with SEO, privacy, security, and accessibility.
Actionable reports
Dashboards prioritize bottlenecks like render delays or asset weight with clear fixes.
Safe, code-level remediation
AllyRight applies optimizations like minification and lazy loading directly in staging with developer approval.
Continuous monitoring
Scheduled speed tests and alerts ensure your site stays fast and compliant.
Performance Features
Speed is the silent driver of rankings, conversions, and user trust. AllyRight finds bottlenecks, applies fixes, and tracks Core Web Vitals so you stay ahead of expectations.
Autonomous Remediation for Website Speed & Core Web Vitals
Automated Performance Crawler: Our crawler analyzes real-world load times, JavaScript execution, and media weight across every page. Unlike lab-only tests, this captures the true user experience.
AI-Powered Performance Fixes: AllyRight recommends and applies optimizations like compression, lazy loading, and code minification. These changes reduce load times immediately without risky manual edits.
Configurable Autonomy for Performance: Teams control which optimizations apply instantly and which need review, striking the right balance between agility and oversight.
Element Location Identification: Every issue includes resource pointers and file paths, giving developers precision instead of guesswork.
Recurring Speed Tests & Dashboards: Daily, weekly, or monthly scans track site speed over time. Dashboards highlight improvements and flag regressions early.
Core Web Vitals & Load Testing
Google PageSpeed & Lighthouse Integration: Your site is tested directly against FCP, LCP, CLS, and other Core Web Vitals metrics. SEO alignment happens automatically.
Performance Percentage & Speed Score: Animated dashboards summarize site performance with simple scores and grades. Stakeholders see clarity, while developers get depth.
Fully Loaded Time Measurement: Reports measure the complete load cycle, including third-party scripts. This reveals exactly when users can interact.
Bottleneck Detection & Analysis: Top bottlenecks like unused CSS or heavy JavaScript are prioritized with suggested fixes. Sprint planning gets sharper.
Redirect & Backend Duration Analysis: DNS lookups, redirects, and server lags are isolated and paired with fixes to eliminate hidden slowdowns.
DOM Interactive & Content Loaded Timing: Metrics show how quickly your site becomes usable. Reports highlight delays that affect perceived performance.
Bulk Testing for Enterprises: Large-scale sites can run mass scans across thousands of pages, ensuring speed at scale.
Asset & Media Optimization
HTML & CSS Validation: Syntax errors and bloat are flagged for cleanup. Leaner markup equals faster rendering.
File Analytics with Performance Grading: Every resource is graded for weight and delivery efficiency. Developers get clear targets for reduction.
Image Optimization Analysis: Oversized images are flagged with recommendations for compression or modern formats. Optimized images improve speed and sharpness.
Video & Audio File Performance: Streaming files are analyzed for buffering risks and CDN distribution efficiency. Optimized delivery improves engagement.
Visual Performance Insights
Visual Loading Timeline Screenshots: Frame-by-frame screenshots show how pages load visually, catching delays that metrics can't explain.
Browser Timing Analysis: Every processing stage — from DNS lookup to paint — is broken down, making debugging precise.
Waterfall Charts Per Page: Interactive waterfalls display every network request, helping pinpoint sluggish assets.
File Type Distribution Graphs: Bandwidth use is shown by file type, helping teams prioritize the heaviest categories for compression.
Reporting & Trends
Performance Metrics Dashboard: Consolidated dashboards give executives high-level speed scores while developers explore detailed metrics.
Historical Trends & Progress Charts: Reports visualize improvements across releases, helping prove ROI and motivate teams.
Core Web Vitals Reporting: AllyRight tracks every Core Web Vital with context and remediation guidance. Developers stay focused on what matters most.
Ready to Supercharge Your Site Speed?
Join hundreds of organizations improving Core Web Vitals and conversions with AllyRight AI.